Technical Depth
I still build. Product leaders who can't engage technically make worse decisions about architecture, feasibility, and build-vs-buy. This is the technical judgment that informs how I lead.
Client Work

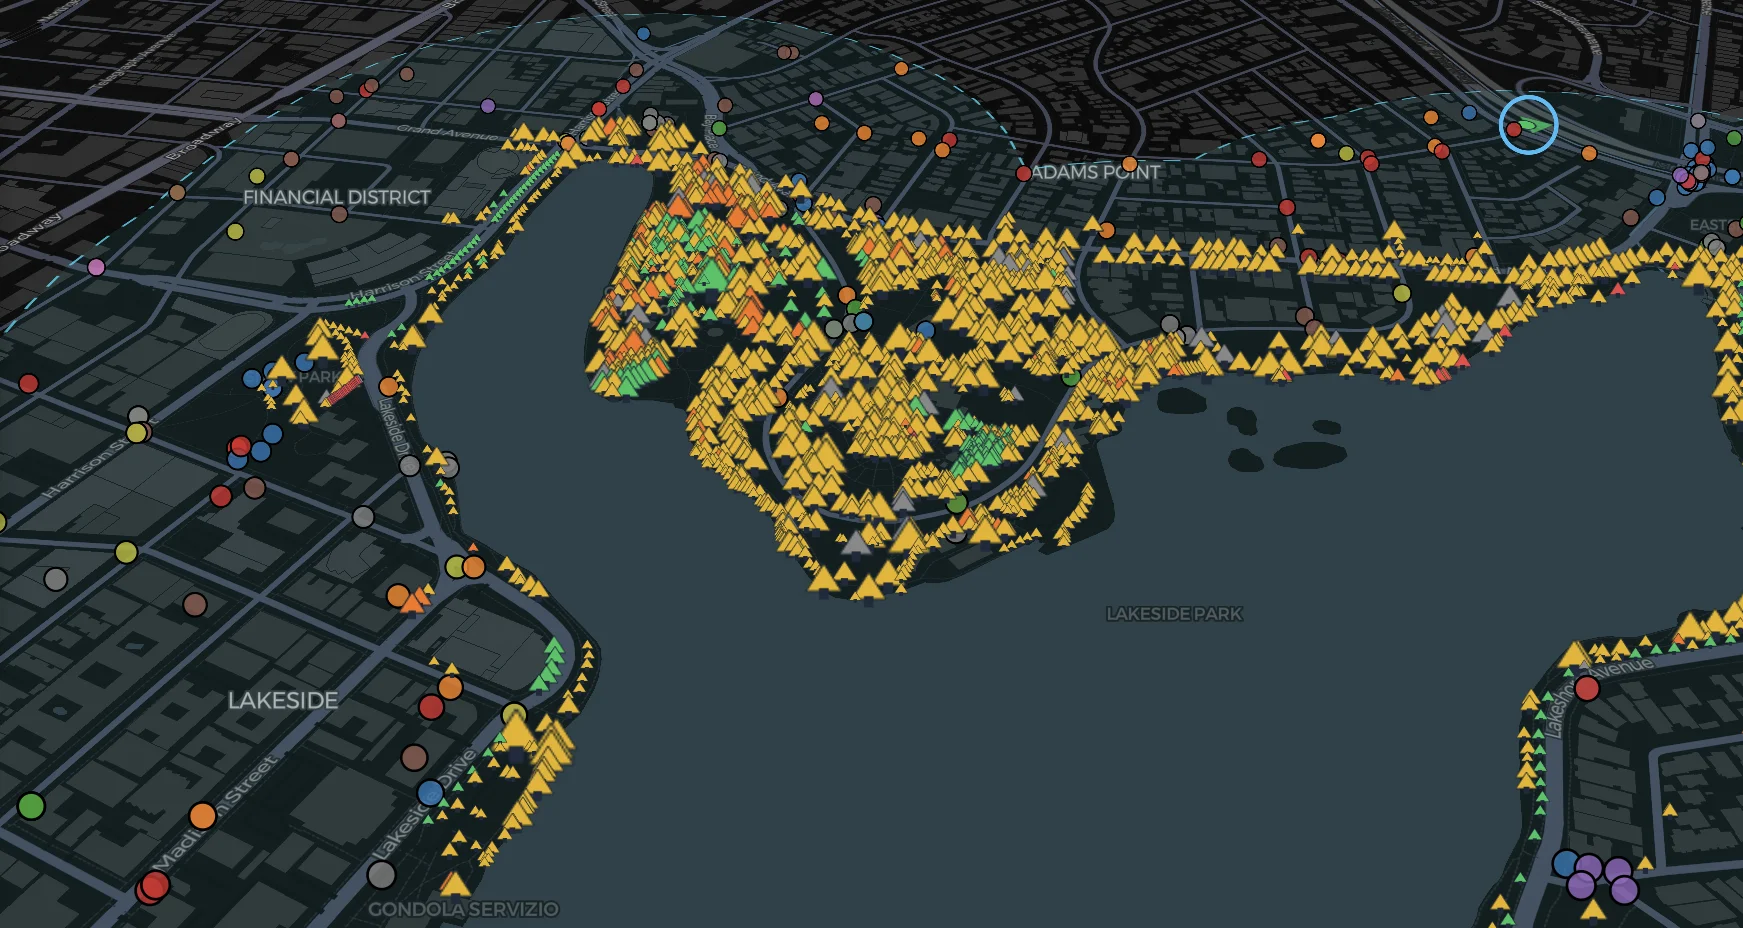
Judicial Selection Map
Brennan Center for Justice
Interactive map of state judicial selection practices across all 50 states and DC, covering State Supreme Court, Appellate, and Trial Court levels.

Campaign Finance Data
Campaign Finance Institute
Interactive visualizations exploring campaign finance data and political funding patterns.

Ribbon
Stanford University
Music visualization exploring melodic patterns and compositional structures.
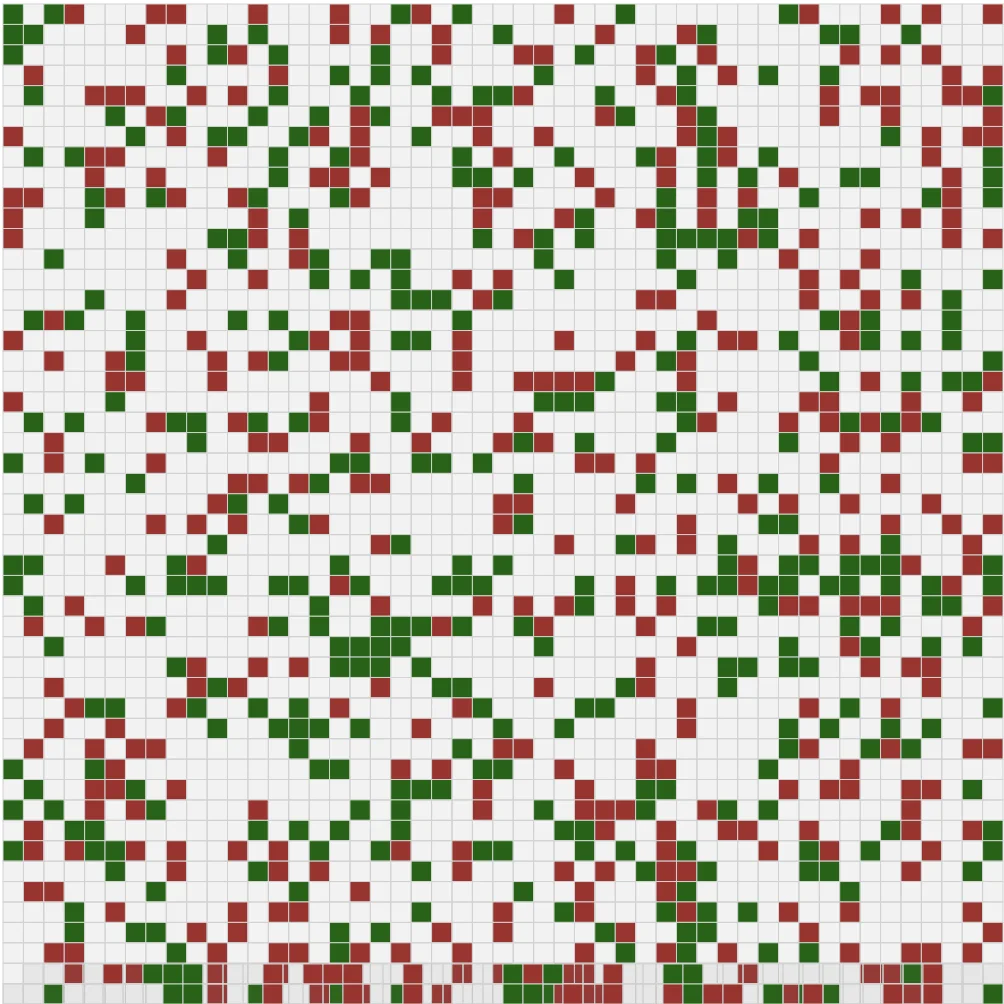
Agent-Based Property Game
UC Berkeley
Game theory simulation exploring cooperation and defection dynamics using cellular automata and agent-based modeling. Collaboration with Thomas Maillart.

Pairwise Voting Detail
Private Commission
Interactive radial visualization of pairwise voting results, showing yes/no vote distributions for organizational decision-making.

Pairwise Voting Overview
Private Commission
Timeline view of all questions across users, grouped by category and ordered by recent activity.